Design
CSS Bar Charts with Flex and attr()

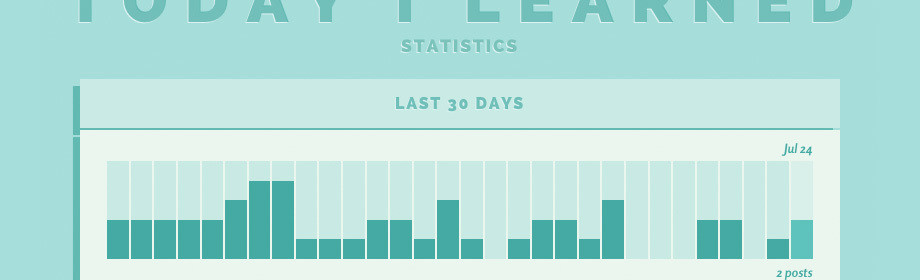
The Hashrocket blog has a little cousin now: Today I Learned is doing quite well for itself these days, with over 200 posts from 13 different Rocketeers since its launch in May. How do I know this? We've got a spiffy new statistics page.
Given that TIL's format lends itself to flurries of bite-size posts from a variety of people, we decided that a statistics page would be a great way to help visitors get a handle on what (and how often) we're posting. We list channels, authors, and most popular posts, all capped by a bar chart showing posts per day for the last 30 days.
After toying with some of our usual graphing libraries, I decided to see if I could pull off building a responsive bar chart, complete with mouseover labels, in just CSS – so I did. Here's how it works.
Structuring the bar chart with flex
I wanted a fully-responsive chart with 30 bars. This is where display: flex really shines. Before flex, I'd probably have to use some table-cell hackery, but no more. With display: flex and align-items: stretch, we can easily make a set of any arbitrary number of bars with 2 pixels in between each; flex handles stretching the bars to the proper width & height.
ul.activity_chart
  display: flex
  height: 10vw
  align-items: stretch
  li
    flex: 1 1
    margin: 0 1px
    background: silver
(If you don't recognize vw units, 1vw is 1% of your viewport's width – check out my TIL post for more hot vw tips.)
Positioning the bars
Once I had the bar backgrounds in place, positioning the bars themselves was simple: I just stuck an absolutely positioned element inside each background element, with a percentage height output by our Rails view:
ul.activity_chart
  // stuff from earlier
  li
    position: relative
    .activity_chart_bar
      position: absolute
      right: 0
      bottom: 0
      left: 0
      background: navy
With each bar positioned to the bottom of their respective bar background, the Rails view could then give each bar a percentage height as an inline style:
%ul.activity_chart
  - posts_per_day.each do |ppd|
    %li(data-date="#{ppd.date}" data-amount="#{ppd.count}" class="#{if ppd.count == 1 then 'singular' end}")
      .activity_chart_bar(style="height: #{compute_percentage(ppd)}%")
You'll note that the %li has two data attributes on it, as well as a class of singular. Those are our CSS graph labels in action.
CSS label hovers: using attr()
Lastly, I wanted the chart labels to not require JavaScript or extra elements of any kind. This is where the attr() property is really useful in CSS: I could set up labels as :before and :after elements on each bar, and define their content by accessing a data attribute using attr(). Here's a subset (minus aesthetic styling) of the code to show the day's date above each bar:
ul.activity_chart
  li
    &:before
      display: none
      position: absolute
      left: 50%
      margin-left: -5rem
      bottom: 100%
      margin-bottom: .5rem
      width: 10rem
      text-align: center
      content: attr(data-date)
    &:hover
      &:before
        display: block
As you'll see, there's some negative-margin stuff to center our label properly, some positioning to stick it on the top of the bar, and content: attr(data-date), which simply takes the text from the aforementioned data-date attribute and sticks it in the :before element. Convenient!
Our hover state also shows the number of posts on a particular day – to accomplish this, we use a lot of the same code from above, plus some different positioning to put it below the bar, and some different content. The content attribute conveniently concatenates attr with any other string info, so we can do this:
      &:after
        margin-top: .5rem
        top: 100%
        content: attr(data-amount) " posts"
And because overlooked pluralization ("1 posts") drives me nuts, here's where that conditional singular class comes in. Having to do this is a little goofy, but hey, CSS doesn't know how to pluralize, so we just have a more robust language tell it what to do.
      &.singular:after
        content: attr(data-amount) " post"
So there you have it – a responsive, CSS-only bar graph, using some nifty new(ish) features. I put together a basic Codepen with the example code from this post, and of course check out the real TIL Statistics page for the full version, which also includes some more hover effects and label-positioning intricacies.
